Wufoo
Using Widgets in Reports
A report is made up of a collection of widgets that display your data as charts, graphs, and tables—widgets are the building blocks of reports. There are five types of widgets: Chart, Graph, Number, Datagrid, and Text. Different widgets work well with different field types to help you clearly display your data.
Managing Widgets
You can have up to 20 widgets on a report with two notable exceptions: You can only use one Datagrid widget per report, and Text widgets don't count towards the limit at all—you can add as may Text widgets as you need.
- Adding Widgets
- Editing Widget Settings
- Deleting Widgets
Chart Widgets
Chart widgets work with all field types. The settings and display options depend on the field type you used in your form.
When editing your report, click the Chart widget in the report preview to open the Chart Settings. You'll need to select the field you want to use for the widget. To help you out, we automatically choose one of the following chart types—the one that makes the most sense for the field type you're using.
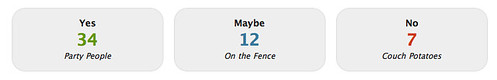
- Bar Chart
- Grid Chart
- Card Chart
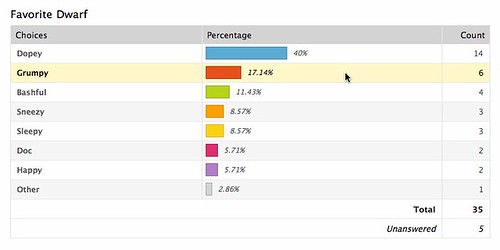


Total Count vs. Unanswered Count: Total Count represents the total number of non-blank submissions for that field. The Unanswered Count represents the number of blank responses for that field. A Checkbox field is considered blank if all selections are blank (has zero checked boxes).
Graph Widgets
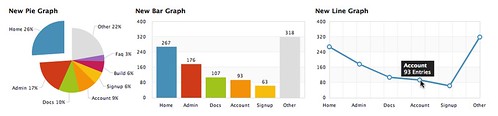
Graph widgets work with all field types. When editing your report, click the Graph widget in the report preview to open the Graph Settings. You can choose to display the data as a small, medium, or large Pie, Bar, or Line Graph. Line Graphs only work with Multiple Choice and Dropdown fields.
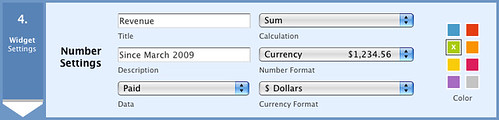
Number Widgets
The Number widget lets you to run a simple calculation on Number, Price, Dropdown, Multiple Choice, or Checkbox field. You can also use Number widgets to get a total of the number of times your form has been viewed, how many submissions you have, your conversion rate, or your bounce rate.
- Number Settings
- Why is the entry count wrong in my report?
Datagrid Widgets

The Datagrid widget displays entry data in a nice, organized table so people easily browse individual entries—it's kind of like browsing entries in a spreadsheet. You can only add one Datagrid widget per report.
Datagrid Settings
When editing your report, click the Datagrid widget in the report preview to open the Datagrid Settings.

| Action | Description |
| Choosing what to display | Check the boxes to choose the data you'd like to display, then save your report. |
| Selecting the number of entries per page | Click the drop-down menu in the lower-left corner of the settings menu to choose the number of entries to display per page. |
| Allowing people to view data not displayed | Turn on (check) the Allow User to View Columns Not Checked setting in the lower-right corner of the settings menu to add a green plus sign to the Datagrid in your live report so people can see other fields you didn't choose to display. If there's data you don't want to share, leave this box unchecked to show only the data you selected for your report. |